Finnix 100 bootchart report
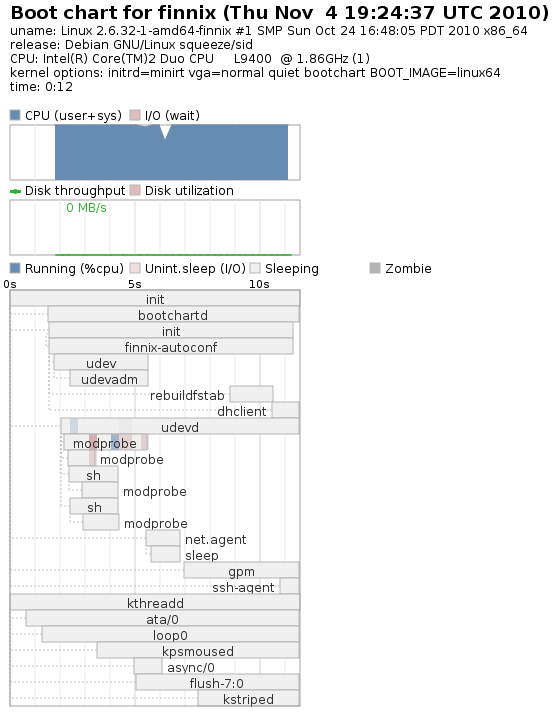
Back in 2006, before the release of Finnix 88.0, I released a bootchart report of the boot process, and it came in at 19 seconds. 4 years later, I decided to try again. This time, we’re down to 12 seconds. Not bad, not bad:
Both tests were completed in a VM with the ISO stored on a local disk. (Actual CD performance in the real world will probably slow down booting a small amount, but considering the CDs are optimized to place all commonly-needed boot files at the beginning of the ISO, seek times should not impact CD booting any significant amount.) Some of the gain can be attributed to faster CPUs (the 2006 test was performed on an Athlon64 3400+, the 2010 test on a Core 2 Duo L9400), but most of it is thanks to better efficiency on the Finnix side. The switch from hotplug to udev allowed many tasks to be parallelized, and “cool down” sleeps within the Finnix boot scripts were eliminated.
Oddly, the disk utilization is not being reported, but the CPU utilization tells the story: in the 2010 test, every bit of processing power is compacted together, speeding the boot process.
